As University Benchmark Project member, you have unlimited access to your data so you can choose benchmarks, select peer institutions, and display reports.
Members can delve into a vast set of benchmarks to get a dynamic view of how their universities and colleges compares to regional and national standards and peer institutions by using various criteria: enrollment, location, mission, size, and more.
“The University Benchmarking Project will assist institutions in making data-conscious decisions to enhance student success across our universities. This will allow us to examine comparative data in a timely manner, saving emails and calls to peer and aspirational institutions to find data that could serve as benchmarks and best practices. The end result will not only be enhanced student success, it will also be time saved which will allow us to improve efficiencies across campus.”
Kathy M. Collins, Ph.D.
Vice President for Student Affairs
University of Rhode Island
National Reports
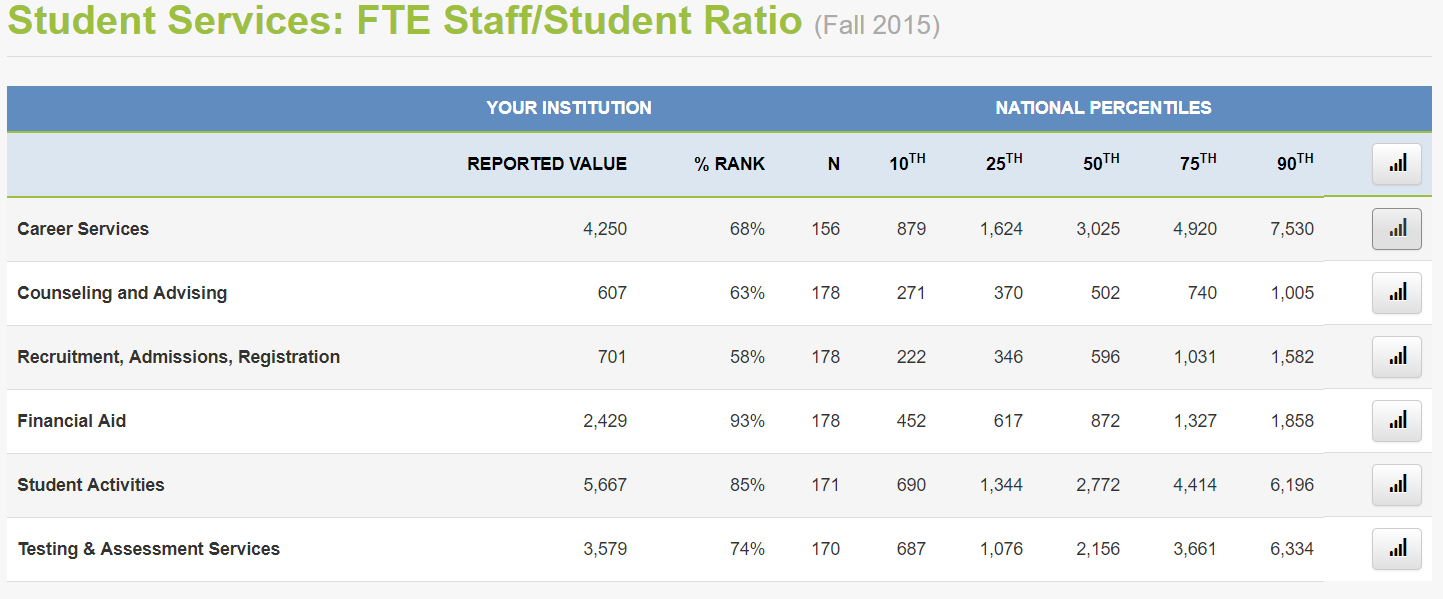
National reports include your institution's benchmark values and percentile ranks, as well as the 10th, 25th, 50th, 75th, and 90th percentiles of national data for each benchmark. Reports can be viewed as both a data table and a graph of performance.
Peer Comparison Tool
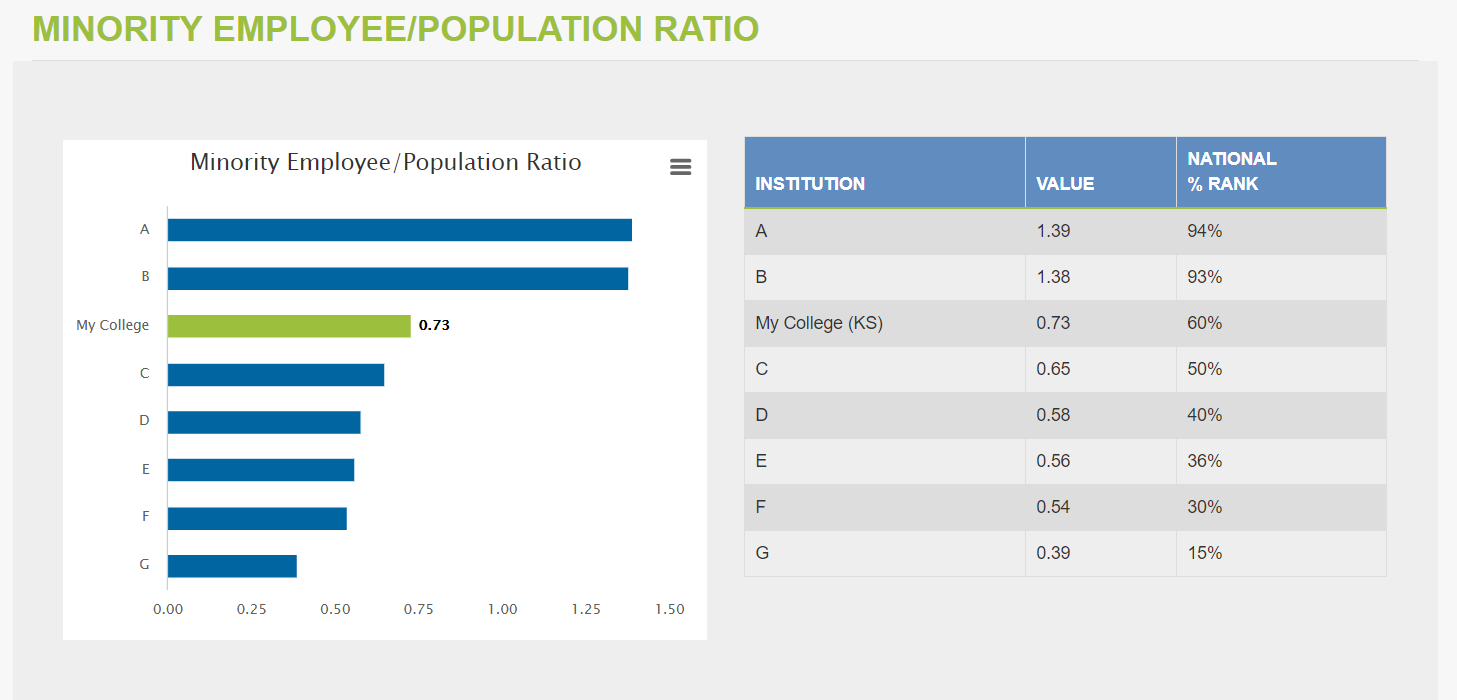
Members have unlimited access to create reports of specific benchmark comparisons to other member universities and colleges. Peers can be selected by name or by demographic characteristics, but note that individual institution results remain confidential. Multiple peer groups can be identified and saved. Your institution is identified by name while peer institutions are identified anonymously.
Custom Reports
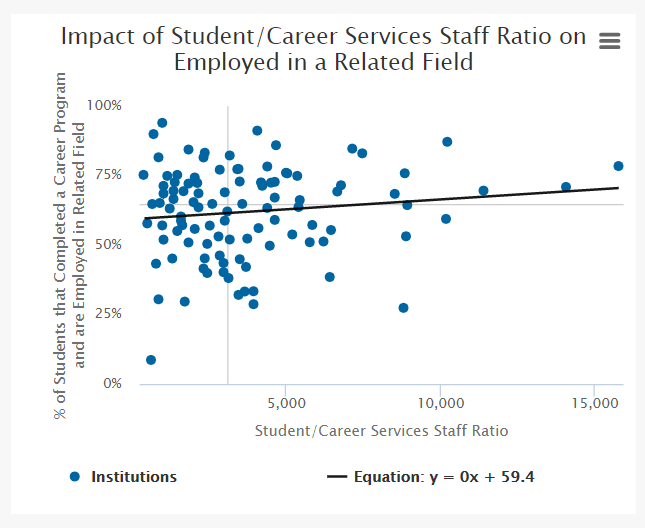
Customize your report to your audience. In a custom report, you can tailor the benchmarks and analysis to evaluate your institution's performance—and communicate these clearly and quickly to your president and other stakeholders.
Members can use bar charts of national results, trend charts, scatter plots and include text boxes to give insight into the data. Additionally, universities and colleges can add peer groups to the charts to illustrate the difference between looking at the national database and looking at their peers.

